Cinnamon Roll Flavored Bar vs Nut Butter Filled Chocolate Hazelnut Butter Energy Bar
Wondering which one to pick? We analyzed the nutritional profile, ingredients, and vegan status to help you decide.
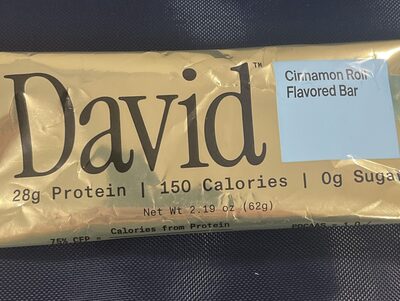
Cinnamon Roll Flavored Bar
Nut Butter Filled Chocolate Hazelnut Butter Energy Bar
The Verdict: Which is Better?
When placing Cinnamon Roll Flavored Bar and Nut Butter Filled Chocolate Hazelnut Butter Energy Bar side-by-side, the nutritional differences become quite clear. Both products cater to specific dietary needs, but picking the right one depends on whether you are prioritizing weight loss, muscle gain, or clean eating.
For calorie-conscious consumers, Cinnamon Roll Flavored Bar is the clear winner. With 198 fewer calories per 100g than its competitor, it allows for more volume while keeping your energy intake in check.
In terms of sugar control, Cinnamon Roll Flavored Bar takes the lead with only 0g of sugar per 100g, whereas Nut Butter Filled Chocolate Hazelnut Butter Energy Bar contains 20g. Lower sugar content is often linked to better metabolic health.
Looking to build muscle? Cinnamon Roll Flavored Bar offers a protein boost with 45.2g per 100g, outperforming Nut Butter Filled Chocolate Hazelnut Butter Energy Bar in this category.
Frequently Asked Questions
Which is healthier: Cinnamon Roll Flavored Bar or Nut Butter Filled Chocolate Hazelnut Butter Energy Bar?
Cinnamon Roll Flavored Bar appears to be the healthier option generally, as it has less sugar and fewer calories.
Is Cinnamon Roll Flavored Bar vegan?
No, Cinnamon Roll Flavored Bar is not certified vegan.
What is the calorie difference between Cinnamon Roll Flavored Bar and Nut Butter Filled Chocolate Hazelnut Butter Energy Bar?
There is a difference of 198 calories per 100g between the two products.