rits bits peanut butter vs layered fruit bar PINEAPPLE PASSIONFRUIT
Wondering which one to pick? We analyzed the nutritional profile, ingredients, and vegan status to help you decide.
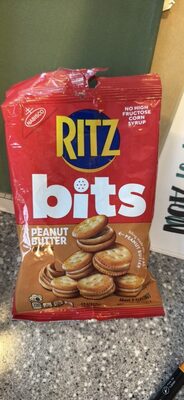
rits bits peanut butter

layered fruit bar PINEAPPLE PASSIONFRUIT
The Verdict: Which is Better?
When placing rits bits peanut butter and layered fruit bar PINEAPPLE PASSIONFRUIT side-by-side, the nutritional differences become quite clear. Both products cater to specific dietary needs, but picking the right one depends on whether you are prioritizing weight loss, muscle gain, or clean eating.
rits bits peanut butter is the more energy-dense option here, packing 184 more calories per 100g than layered fruit bar PINEAPPLE PASSIONFRUIT. If you are looking for sustained energy or fueling a workout, this higher caloric density might be an advantage.
In terms of sugar control, rits bits peanut butter takes the lead with only 13.79g of sugar per 100g, whereas layered fruit bar PINEAPPLE PASSIONFRUIT contains 66.7g. Lower sugar content is often linked to better metabolic health.
Looking to build muscle? rits bits peanut butter offers a protein boost with 10.34g per 100g, outperforming layered fruit bar PINEAPPLE PASSIONFRUIT in this category.
Frequently Asked Questions
Which is healthier: rits bits peanut butter or layered fruit bar PINEAPPLE PASSIONFRUIT?
It depends on your goals. rits bits peanut butter has 517 calories, while layered fruit bar PINEAPPLE PASSIONFRUIT has 333 calories. Check the detailed table above for sugar and fat content.
Is rits bits peanut butter vegan?
No, rits bits peanut butter is not certified vegan.
What is the calorie difference between rits bits peanut butter and layered fruit bar PINEAPPLE PASSIONFRUIT?
There is a difference of 184 calories per 100g between the two products.